Climate Note · May 6, 2025
Explore 16 Years of U.S. Climate Opinions with the CCAM Explorer
By Emily Goddard, Jennifer Marlon, Matthew Ballew, Jennifer Carman, Andrew Gillreath-Brown, John Kotcher, Edward Maibach, Seth Rosenthal and Anthony Leiserowitz
Filed under: Audiences, Behaviors & Actions, Beliefs & Attitudes and Policy & Politics

We are pleased to announce a new version of the Climate Change in the American Mind (CCAM) interactive dashboard – the CCAM Explorer. You can also download the full dataset, which includes 31 waves of data from the Climate Change in the American Mind study, from the Open Science Framework.
The tool and dataset include data from 2008 to 2024, letting you investigate changes in Americans’ opinions about climate change over time and across different demographic and political groups. A few highlights:
Climate Opinion Gaps: Age and Partisanship
The “Climate Views by Demographics” tab shows that younger Republicans are much more likely than older Republicans to believe that climate change is happening and human-caused. 57% of Republicans under 35 believe climate change is happening vs. 43% of Republicans aged 55+ years – a 14-point difference. That’s nearly triple the difference among Independents (5 points) and much larger than the difference among Democrats (94% for 35-54 year olds and 93% for others). Likewise, 35% of young Republicans (18-34) and 38% of middle-aged Republicans (35-54), compared to only 28% of older Republicans, are worried about climate change. Among Democrats, however, climate worry is high across all age groups, with just a 4-point age difference (93% of 18-34 year olds vs. 89% of 55+).
A key finding: in some cases, the differences between younger and older Republicans are nearly as large as the differences between Democrats and Republicans.

An even larger gap: 49% of younger Republicans vs. 30% of older Republicans support transitioning the US economy to 100% clean energy by 2050 – a 19-point difference (Fig. 2). Among Independents, the difference between younger and older age groups is 8 points (72% vs. 64%). Among Democrats, support is similar across all age groups (92%).
Meanwhile, majorities of Republicans 54 years old and younger, Independents and Democrats of all ages, and nearly half of older Republicans (47%) support teaching global warming in schools (Fig. 2).

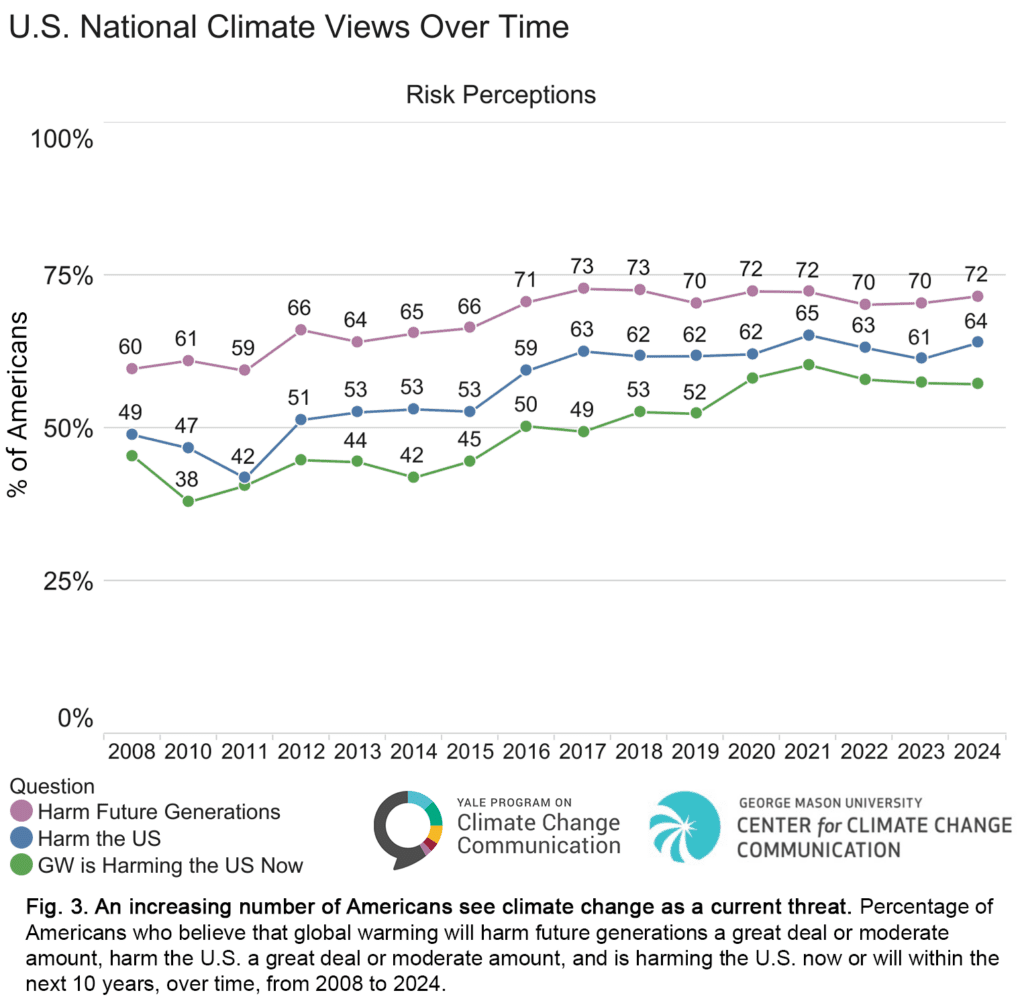
National Trends in Risk Perceptions
Since 2008, an increasing majority of Americans have perceived global warming as a threat to future generations. The “Climate Views Over Time” tab shows that this has grown from 60% in 2008 to 72% in 2024 (Fig. 3). Americans also increasingly understand that climate change is not distant in time and space, but a current threat to people in the U.S. Since 2012, a majority of Americans have believed that climate change will harm the U.S. a great deal or a moderate amount (currently 64%), and since 2018, a majority have believed that global warming is harming the U.S. right now (currently 57%). Amidst a growing number of extreme weather events in the U.S., such as the recent wildfires in Los Angeles, heatwaves in the southwest, and hurricanes in North Carolina and Florida, it’s important to continue to communicate the ways in which climate change is affecting people in the U.S. right here and now – and will for generations to come – unless we reduce carbon pollution.
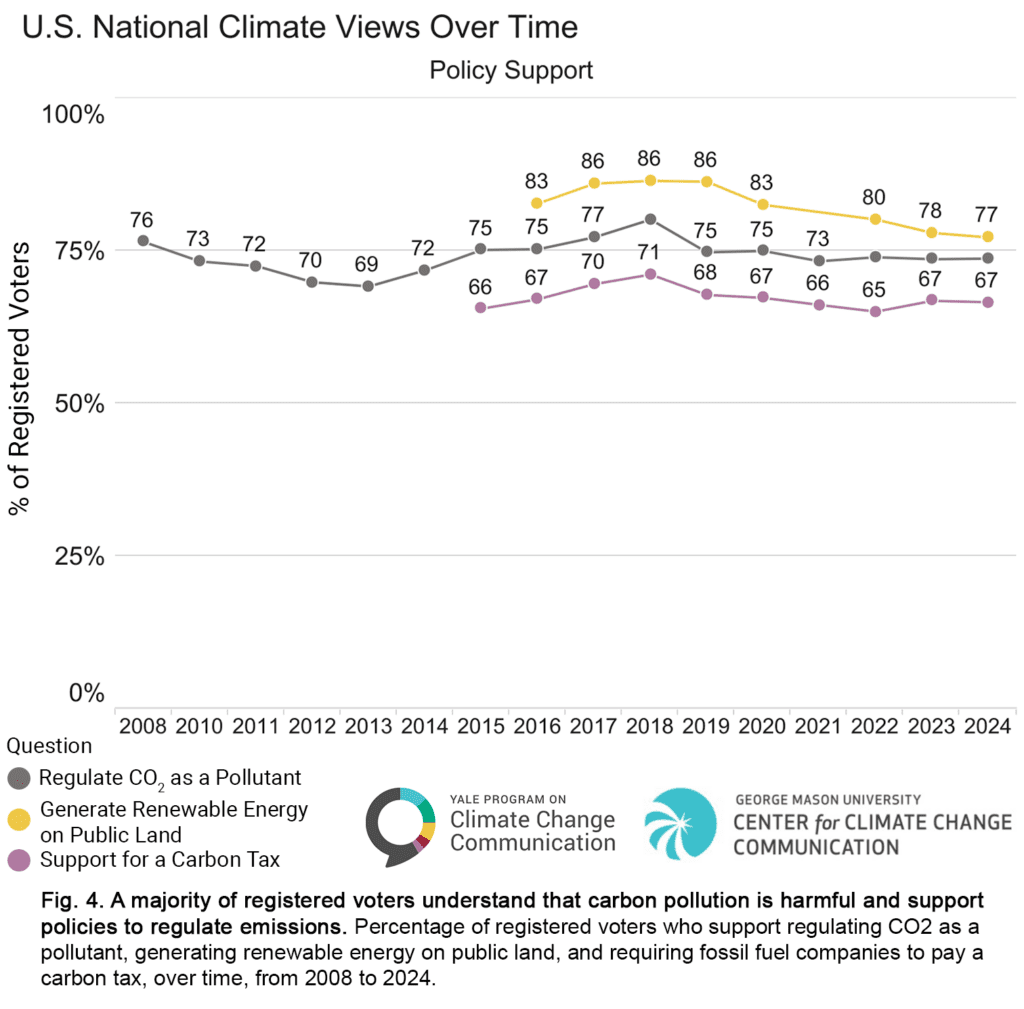
National Trends in Policy Support
A large majority of registered voters understand that carbon pollution is harmful and support policies to regulate or tax carbon emissions. Consistently, since 2015, about three out of four (or more) have supported regulating CO2 as a pollutant (currently 74%), and about two out of three have supported requiring fossil fuel companies to pay a carbon tax (currently 67%) (Fig. 4). Nearly two out of three registered voters (65%) also support the transition of the U.S. economy to 100% clean energy by 2050.
Explore the CCAM Explorer by navigating the three tabs at the top of the tool—Climate Views by Demographics, Climate Views Over Time, and Politics and Climate Views—to view detailed data breakdowns. You can also customize the data displayed on each tab by using the dropdown menus (e.g., select questions, time period, and baseline sample, such as registered voters or all adults).
Understanding Americans’ climate change beliefs, worries, and policy support, and how these views vary among political parties and demographic groups, can inform climate change communication, advocacy, and policies. We hope that this data will be useful to you and your work.